Slack.Insights Crew: understanding the mood of a remote-working team

Antonio Mazzei
Principal, technology
Transformative innovation
2021

When tones of voice, expressions, and faces are substituted with digital communications, how can we tell apart the emotions and moods of a team that works remotely?
Step into the shoes of a project manager or an executive interested in looking at more projects concurrently, or trying to understand how employees are experiencing their workday: how can they understand their enthusiasm, stress, companionship, feeling of collaboration?
What is certain is that, when we work remotely, we do not stop communicating, and we keep doing so through the hundreds of messages we send each other every day on the numerous tools and platforms at our disposal. It is true, then, that part of those signals usually exchanged face to face (like our tone of voice or our facial expressions) are not entirely eliminated, but rather translated into another language: the words and phrases we use to vitalize those messages.
For this reason, a small group of us — computational linguistics experts — has decided to try and go a bit further into the topic with the formation of the Slack.Insights Crew, born at the intersection of a contemporary dilemma (the interpretative reading of moods and the output quality of a remote-working team) and one of our areas of expertise (linguistic analysis).
The goal of the Crew has been clear from the start: finding new tools and methods to evaluate, gather up, and objectively distribute, over time, the emotions felt by a group that works remotely, analyzing the quality of the interactions happening through written text in the chosen communication channels, such as Slack.
It goes without saying that, as soon as we started working, we already knew that we had a piece of the answer, namely the tool to use: our text analytics platform CELI Analytics.
CELI Analytics is a text mining and text analytics platform that allows us to automatically organize and systematize bodies of text, cluster documents, identify opinions and sentiment, configure automated analyses for a specific interest area, and link the extracted information with other available data.
How did we use it? Let us tell you.
Disclaimer: we want to clarify that this kind of analysis is designed for group work, not as a control system for individuals. The analysis of texts and written messages is made anonymously, respecting individual user privacy.
Phase 1 → Defining the project’s perimeter
Before getting started, it was important to define the outside perimeter, which meant the sources of the texts under analysis and the emotions to intercept.
Following the teaching of the dear departed André Delambre (ever watched The Fly?), as far as the sources of the text go, we have decided to use ourselves as test subjects, and analyze the messages exchanged over four channels in our internal chat dedicated to four different projects, which amounted to about 20,000 messages. We did not check the channels in real-time, but extracted the messages sent over the last nine-month period.

With regard to emotions to intercept, even though it would have been interesting to observe the entire emotional spectrum of the models used in the whole scientific literature (like Ekman and Plutchik), we lingered over those that we believed were characterizing for the kinds of interactions that happen in a workgroup: frustration, anxiety, deadlocks, enthusiasm, serenity, empathy.
Phase 2→ Teaching MAIZE Analytics how to recognize emotions
Once these parameters were defined, the first thing we did was extract the text messages from the designated Slack channels, and begin the training of CELI Analytics on emotion detection. How? Using one of its specific features, deep learning, which is the training of neural nets and the classification of contents using examples.
What does it mean? you might be asking. Don’t worry; we’re getting into that. CELI Analytics’s neural nets have already been trained on a vast dataset, which has taught them a language model. However, its knowledge needs to be honed each time with the specific requests of the task at hand.
This happens through a three-step iterative process:
- Manual pairing: we first manually paired some of the contents from the Slack chats with our selected moods and emotions (at least 100 examples per emotion);
- Automated annotation: we then kicked off the training, and took notes for all the messages automatically;
- Calibration: we then evaluated the quality of the results using a test set, recalibrating the model as necessary (with new examples and the signaling of wrong categorizations), to then go back to automated annotation.
Following this process, we trained CELI Analytics to automatically group the messages in accordance with the project, emotion, and day.
Phase 3 → Adding and grouping information
The following step, starting from the training results, consisted in filling out the extracted data with other data needed to interpret CELI Analytics’s grouping effectively. For instance, we created an emotional baseline matching the average values of each project channel to catch potential significant variations.
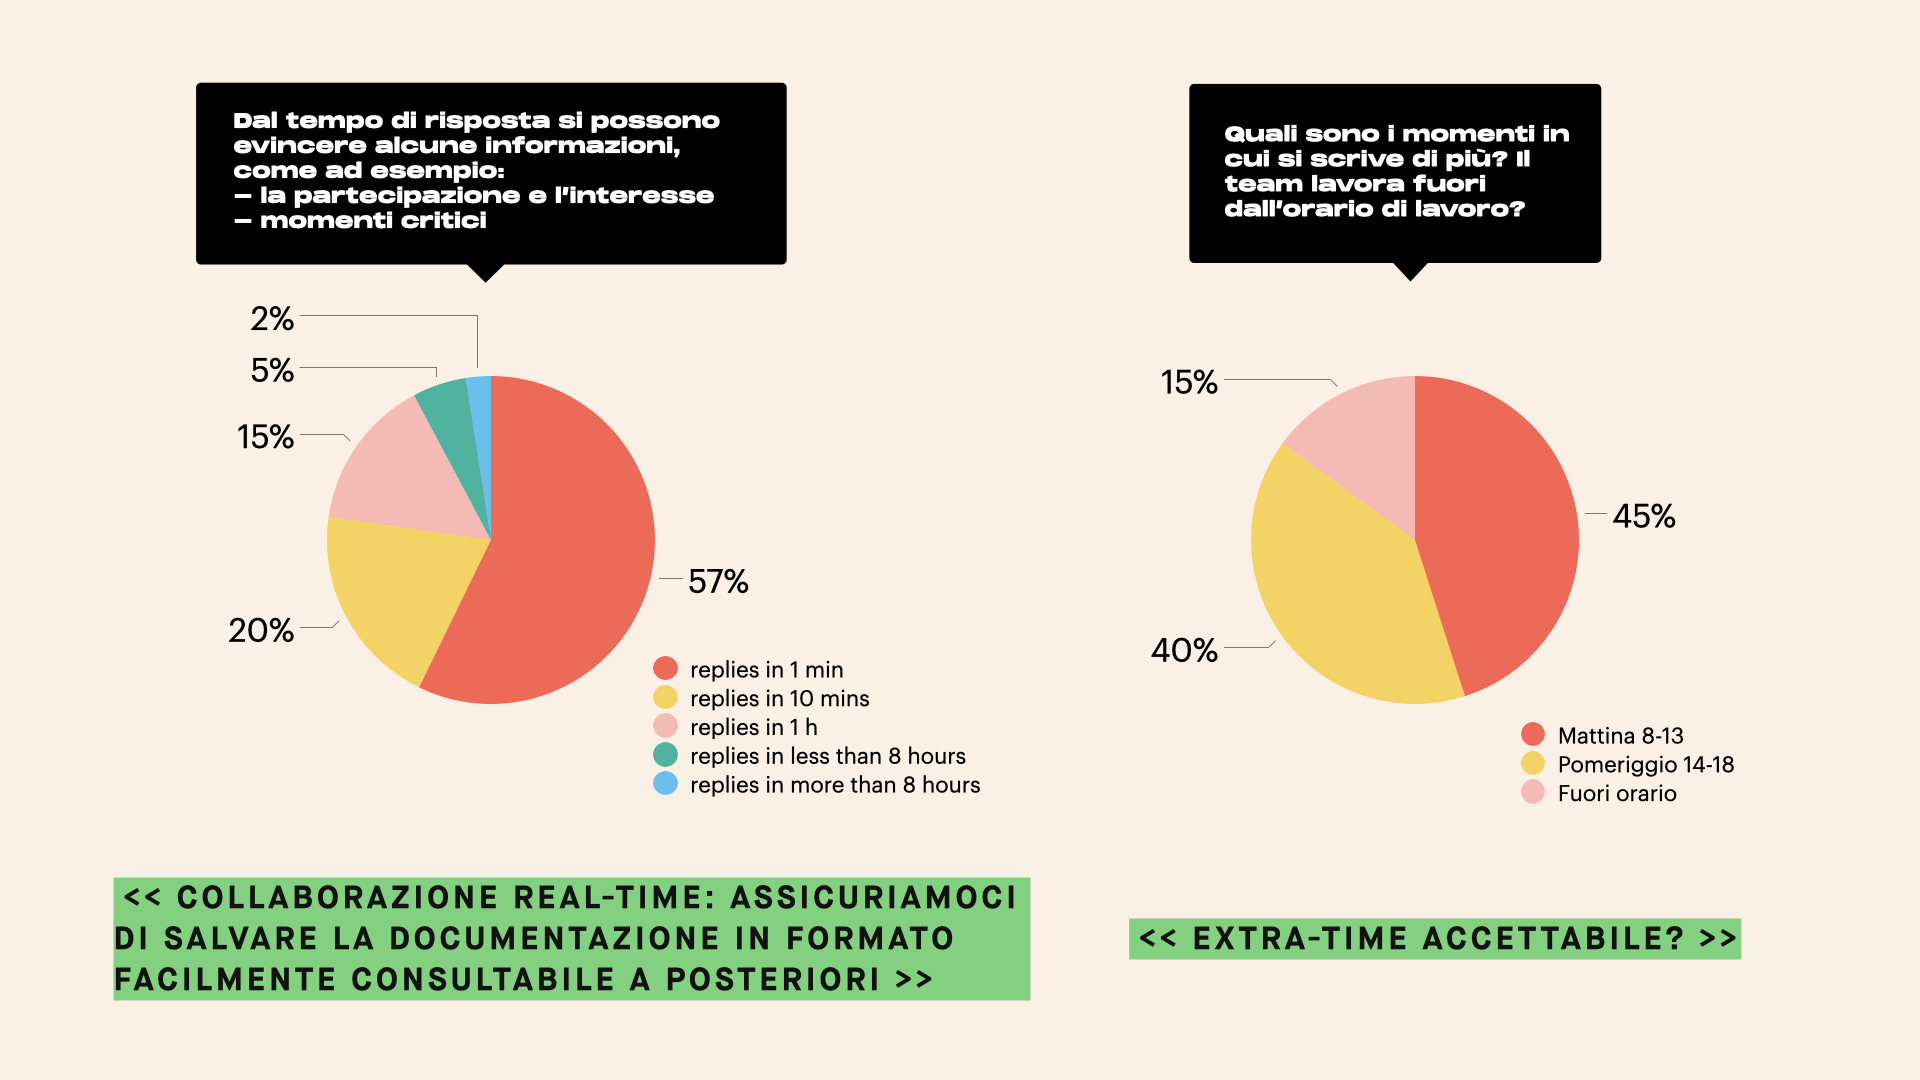
This information is essential, as it allows us to monitor the tendency of emotions over time compared to the average values and thus detect anomalies. Other additional data was instead concerned with the quality of working life, like the average time needed to give back an answer or the distribution of the various communications in a given day.
Mixing and matching all this information, we have come to a series of visualizations that have allowed us to understand the mood of the working group better, answering the questions that a project manager or an executive interested in understanding how a team is actually feeling might have.
This is how it has gone for one of the channels under examination, dedicated to the management of an eight-month-long project.
Phase 4 → The final reading of moods
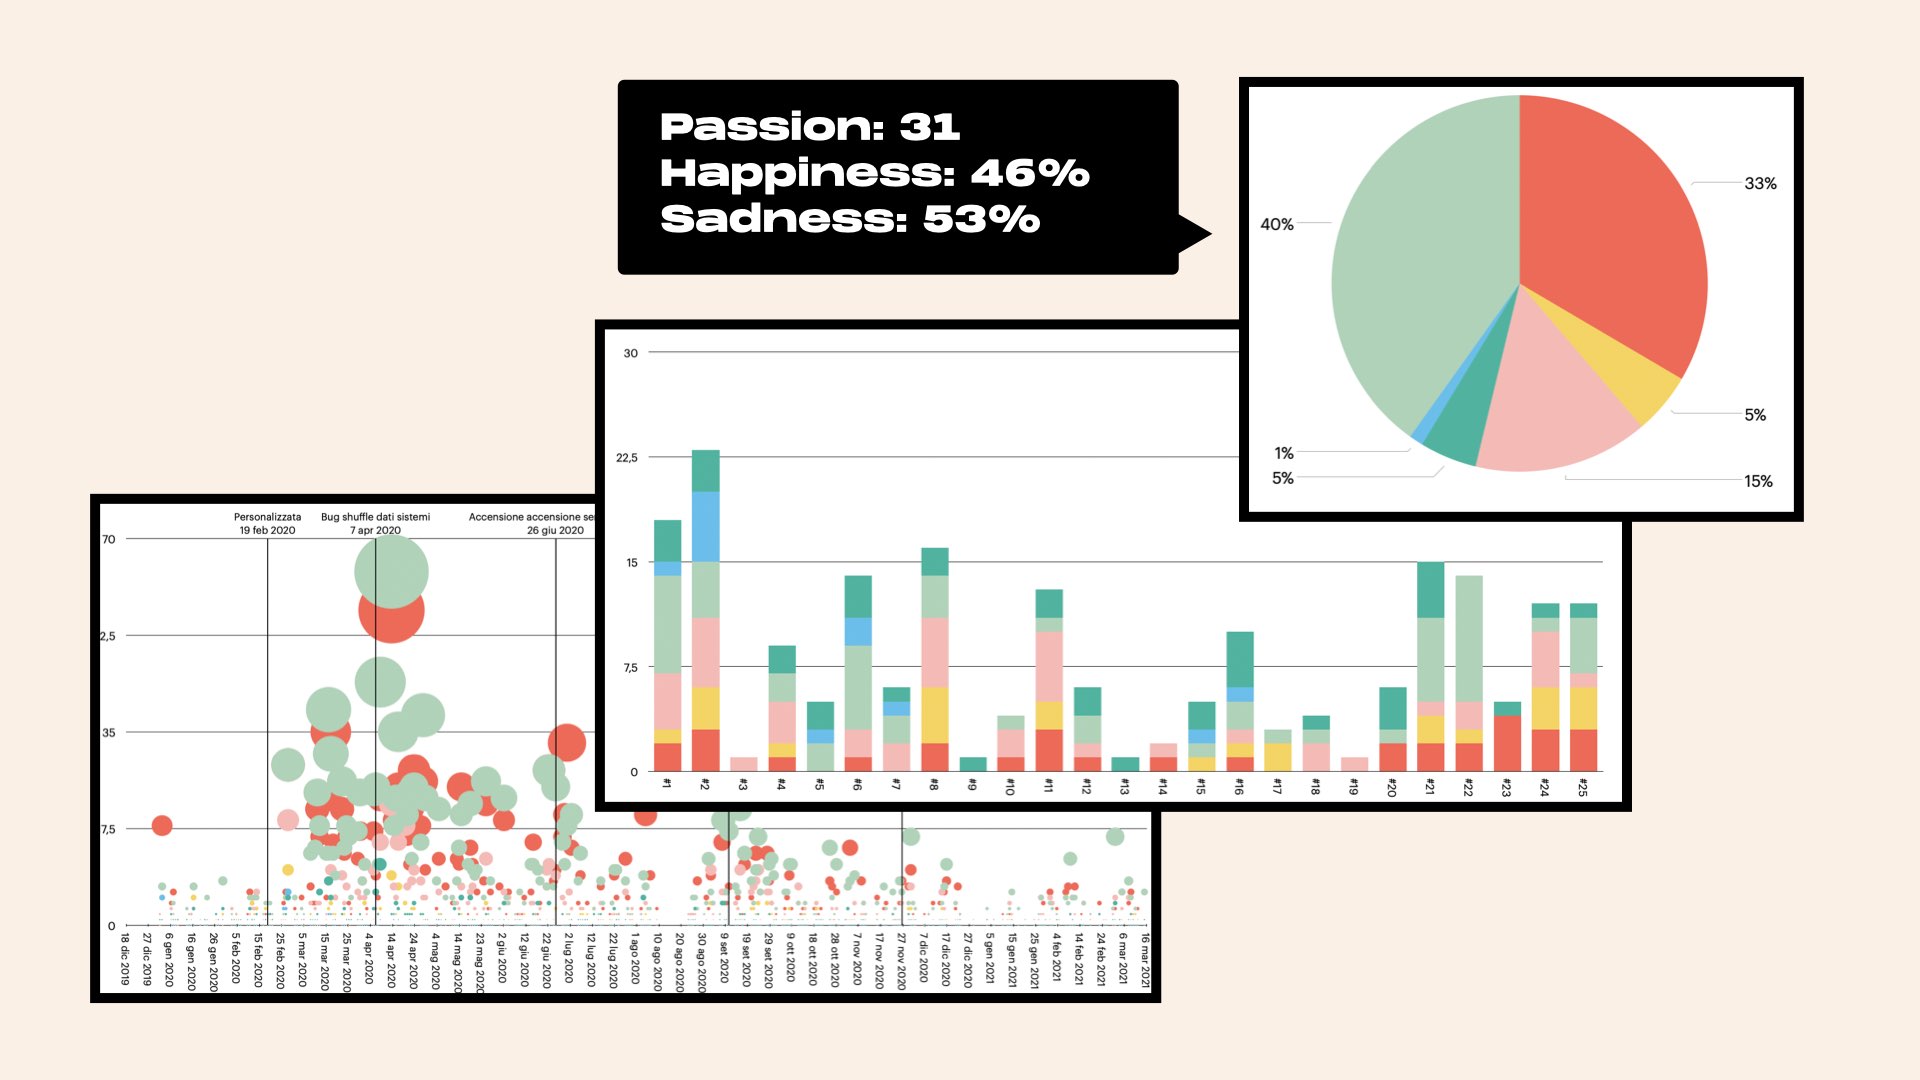
The first visualization we have created with the data parsed by CELI Analytics is a pie chart that distributed the various emotions exchanged through the messages inside the project channel. It immediately shows the vast range of emotions involved in a complex, challenging project, where both frustration and deadlocks manifested. However, a cohesive, tenacious, and empathic group also came through.

We then matched the distribution of emotions over time (grouped by day) with relevant moments in the project’s life (e.g.: kick-off, sprint review, demo), which allowed us to pinpoint particularly intense and stressful moments.

The analysis of emotions aggregated per user, on the other hand, made it possible to identify possible criticalities in the communications inside a specific team. Indeed, if such an analysis were to be compared to the performance of a single individual in multiple projects, we could highlight problematic situations. If, for example, Mr. Pink looks stuck on a project while he’s usually doing ok, it might be worth examining the causes of the issue.

Last but not least, the analysis of response times and working hours, in general, told us of a reactive group that is not afraid to put in some extra effort.
What did we learn?
In terms of methodology, we confirmed that when we want the data to speak, we need to be able to listen without bias. It is no use to look for something in the data if it doesn’t exist: in our case, looking for “traditional” emotions (rage, fear, love, etc.) would have been entirely unhelpful. We need to analyze data with an open mind and ask ourselves how to best use the signals we do intercept. In our experiment, for instance, we matched the signals relative to emotions with the project’s timeline and calculated the deviations against the average. That made it possible to identify and deal with anomalies and criticalities.
We experimentally verified that promptness in getting aggregated data (like the team’s emotional state) can be enormously helpful in handling (and reviewing) projects when working both remotely and on a tight schedule.
Can we use what we learned in other contexts? We believe so, yes; particularly when it comes to all those cases in which users exchange a lot of messages to comment on a shared experience. For instance, the comments that flow during an online event (like a webinar, a hackathon, a live TV show) can be used to check the public’s pulse and see what generates the strongest reactions and engagement; what works and what doesn’t.


